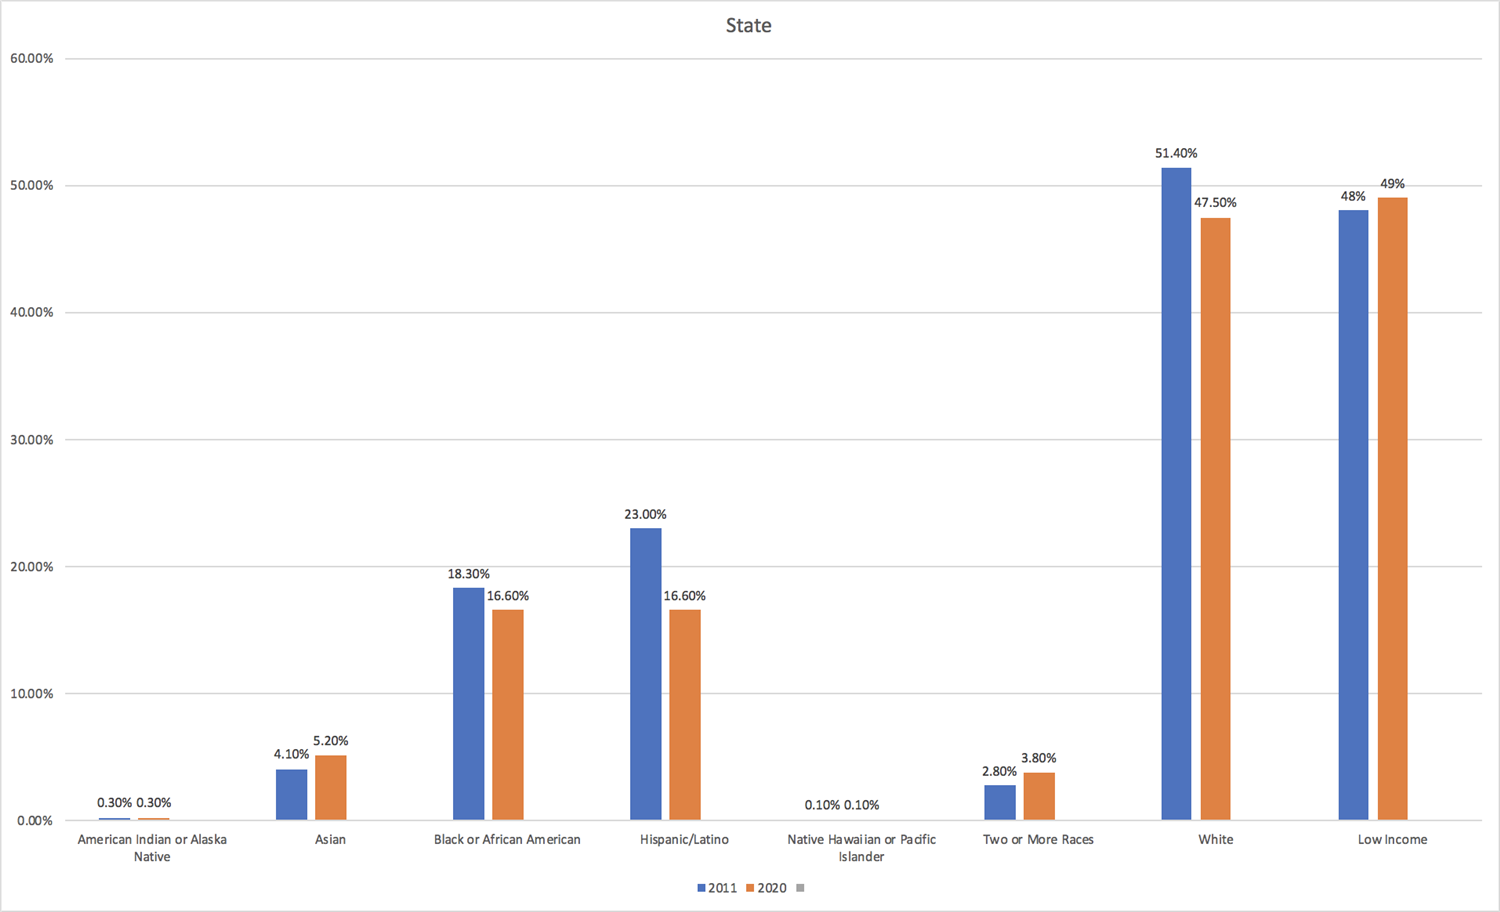
About Us
Page Navigation
- About Us
- Annual Reports
- District Improvement Plan
- District Map / Feeder Schools
-
Equity Work
- Demographics and Data
- Portrait of a Graduate
- Board Policies and Guiding Organizations
- Equity Timeline
- Gender Support Plan
- Curriculum
- Post Secondary Education
- Student Voice
- Equity Team
- Celebrations
- Strategic Plan - Vision 307: In Focus
- Policies and Procedures
- home.
- AP Honor Roll
- Illinois Report Card 2023-2024
Demographics - 2011 vs. 2020
-
State
Graph Information:
American Indian or Alaska Native:
2011 - 0.30%
2020 - 0.30%Asian:
2011 - 4.10%
2020 - 5.20%Black or African American:
2011 - 18.30%
2020 - 16.60%Hispanic/Latino:
2011 - 23.00%
2020 - 16.60%Native Hawaiian or Pacific Islander:
2011 - 0.10%
2020 - 0.10%Two or More Races:
2011 - 2.80%
2020 - 3.80%White:
2011 - 51.40%
2020 - 47.50%Low Income:
2011 - 48.00%
2020 - 49.00% -
BBCHS
Graph Information:
American Indian or Alaska Native:
2011 - 0.55%
2020 - 0.24%Asian:
2011 - 1.56%
2020 - 2.10%Black or African American:
2011 - 10.54%
2020 - 10.11%Hispanic/Latino:
2011 - 9.49%
2020 - 14.24%Native Hawaiian or Pacific Islander:
2011 - 0.14%
2020 - 0.00%Two or More Races:
2011 - 1.90%
2020 - 5.79%White:
2011 - 75.80%
2020 - 67.48%Low Income:
2011 - 32%
2020 - 41%
-
*all reported data comes from the Illinois State Board of Education